About
Multipurpose Uncertainty Quantification and Sensitivity Analysis Toolbox
The mUQSA portal provides a comprehensive system for the automated uncertainty quantification (UQ) and sensitivity analysis (SA) of computational models. It implements proven methods such as Monte Carlo (MC), Polynomial Chaos Expansion (PCE), and Stochastic Collocation (SC), and offers an intuitive web interface and efficient backend layer that comprehensively support development, execution, and analysis of the results of a computational model.
Info
Uncertainty Quantification (UQ) is a mathematical framework used to understand and quantify the uncertainty in model predictions or simulations. It provides a systematic approach to quantify impact of uncertain or unknown inputs on the model output. UQ techniques can range from simple statistical methods to more complex probabilistic models and can involve different types of input parameters, such as model parameters, boundary conditions, or measurement errors. UQ is widely used in fields such as engineering, physics, and climate science where accurate and reliable predictions are critical.
Sensitivity Analysis (SA) focuses on the influence of different uncertain parameters on the model output. It provides a systematic approach to identify the most important input parameters that affect the model output and quantify their impact. By performing Sensitivity Analysis, it is possible to determine which input parameters should be carefully measured or controlled to ensure the reliability and accuracy of the model output. Sensitivity Analysis is widely used in engineering, finance, and other fields where mathematical models are used.
Single platform, multiple use-cases
mUQSA is a generic purpose tool that can be used to analyse applications of different kinds and complexity from a variety of scientific and technological fields. On the other hand, the platform builds upon a number of automation techniques that make its usage relatively simple regardless of the scenario and experience of a user.

A picture is worth a thousand words
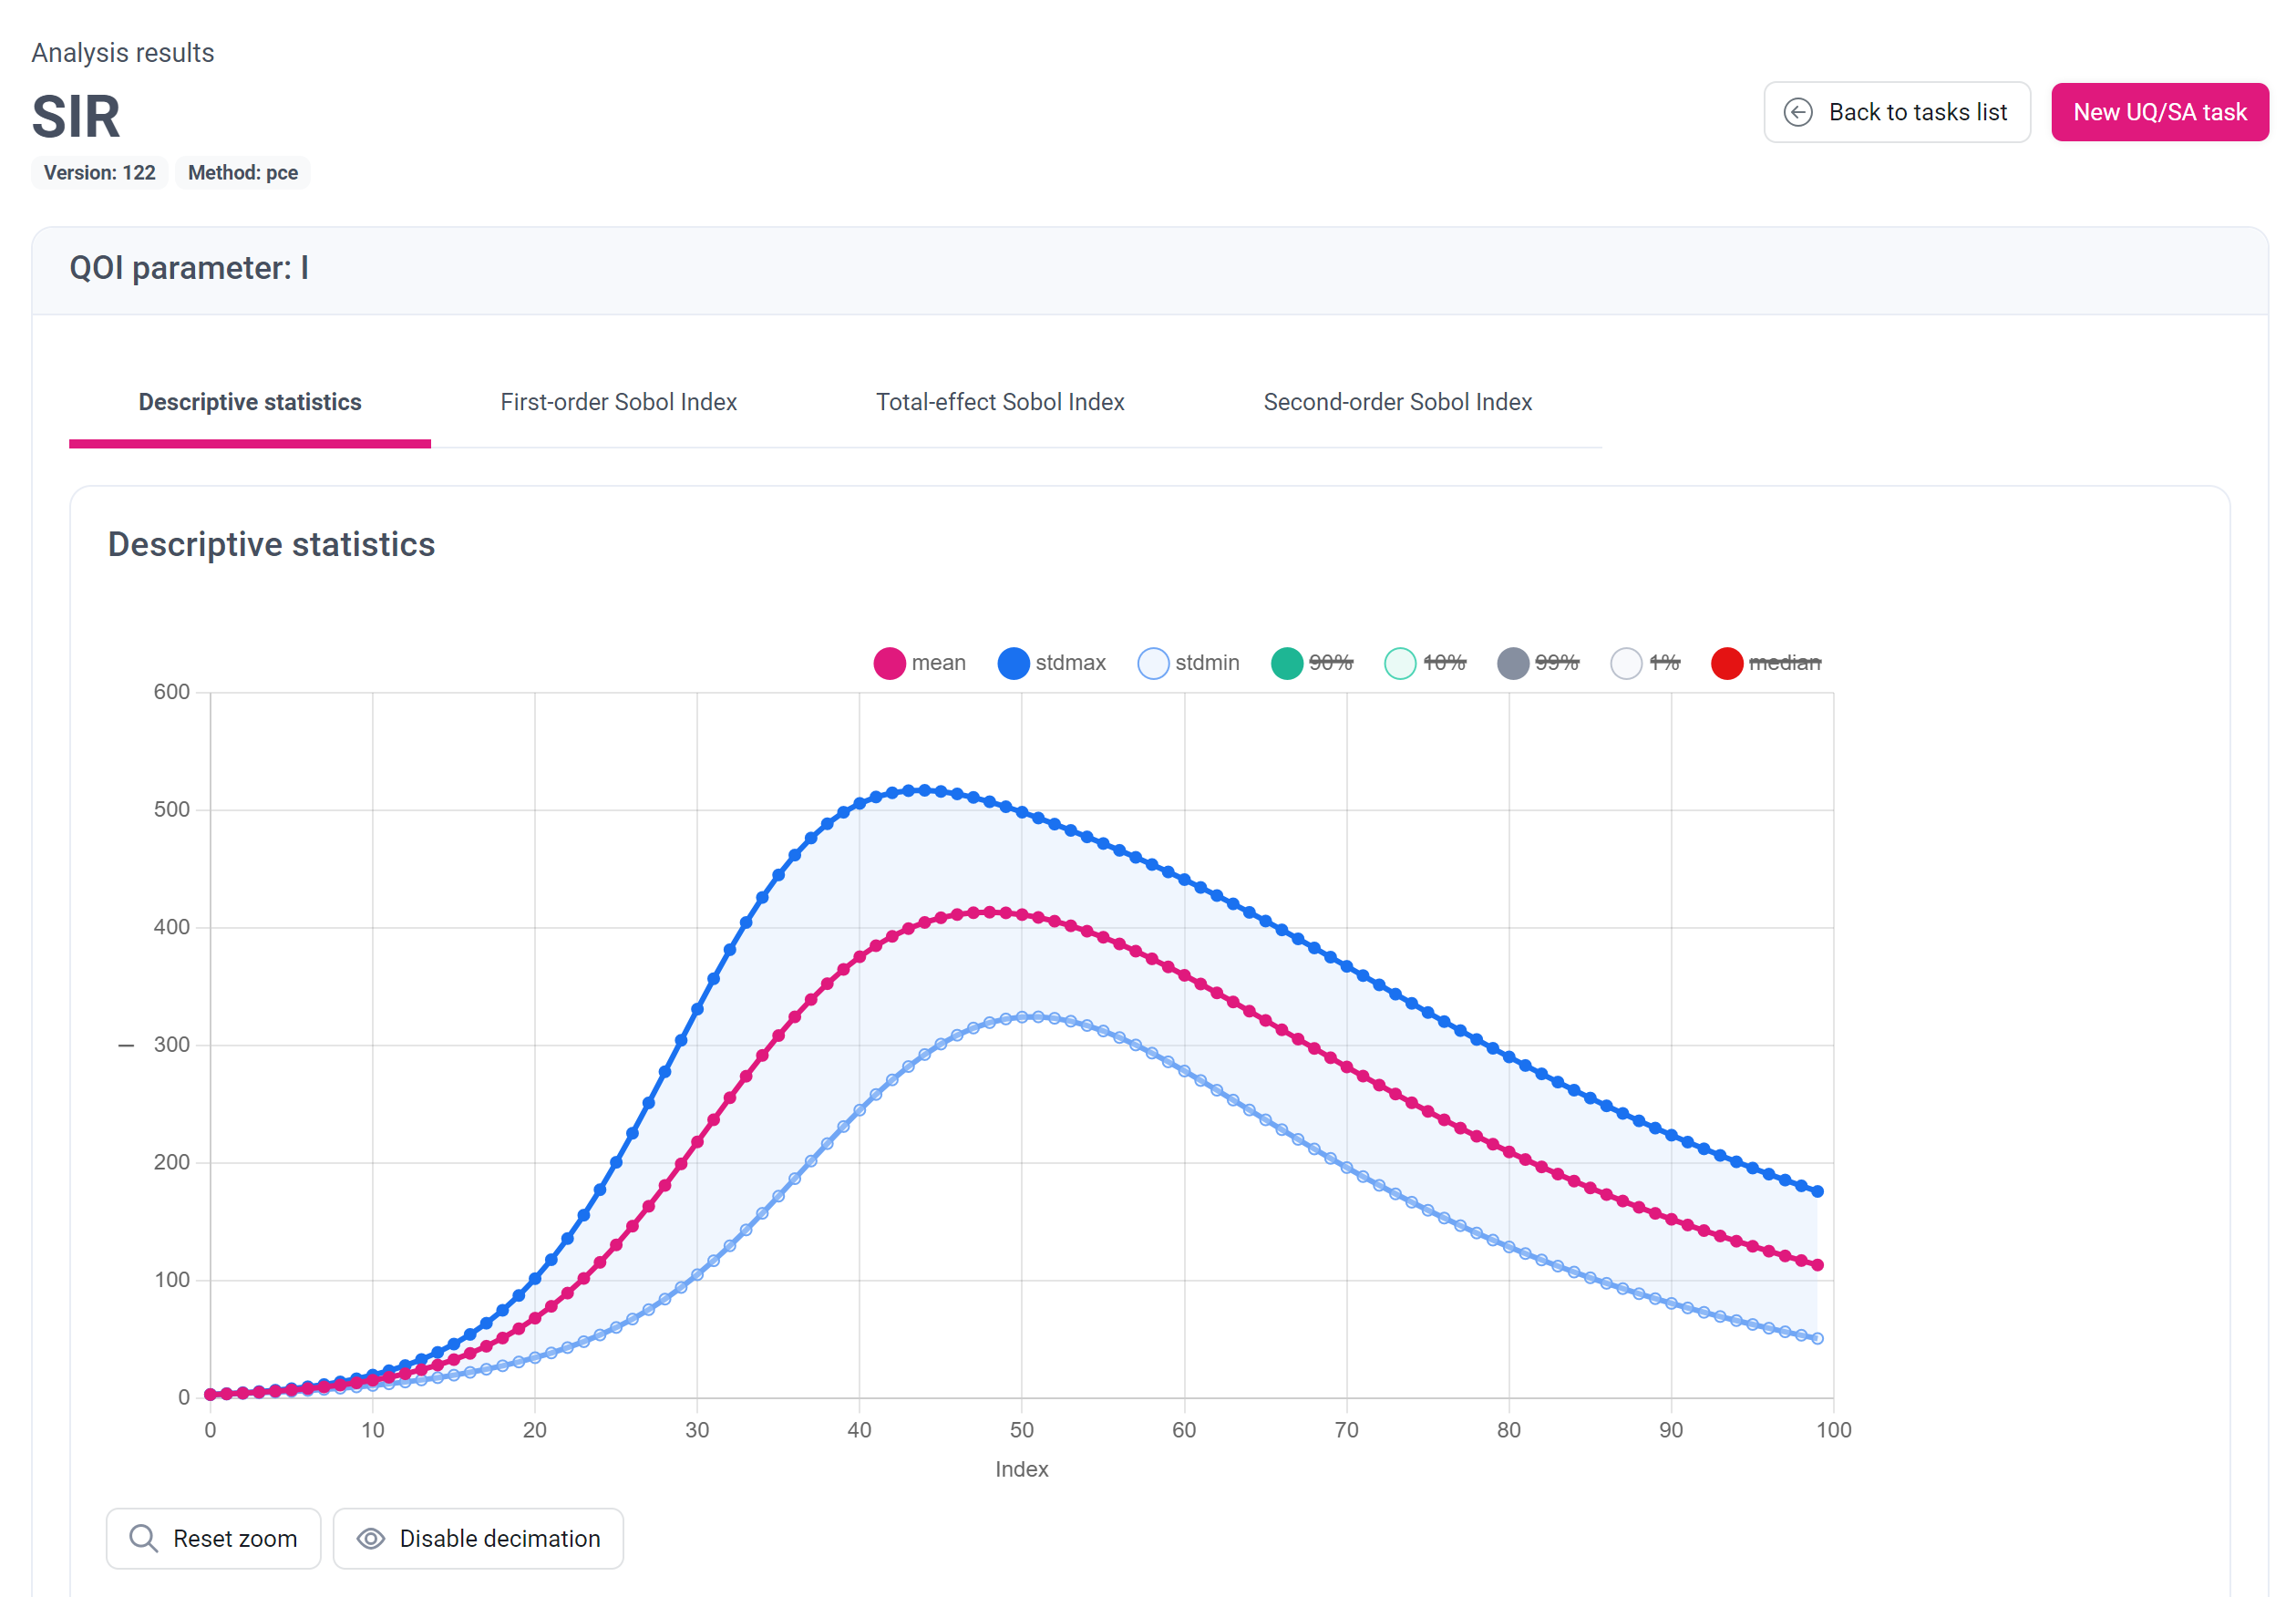
The platform generates various types of plots, charts, and graphs, allowing users to explore the behavior and uncertainties of their models in an intuitive and meaningful way. The visualization tools provided by the mUQSA portal enhance the interpretation of the results, providing users with insights and identifying trends that might not be apparent from the raw data alone. Overall, the combination of automated analysis and intuitive data visualization makes the mUQSA portal a powerful tool for understanding and improving complex models.